
The Long Way Back · Part 2 of 5
Who Is Drinking Bourbon in 2036?
Fewer Americans drink, and the young drink least. The category is not collapsing, but the next cohort is smaller, and it is reaching for a different glass.
Americans bought 30.0 million nine-liter cases of American whiskey in 2025. That is 4% below the 2022 peak and 79% above 2012.
Both halves of that sentence matter. The category stopped growing after a decade in which it never once shrank; it did not fall off a cliff. Supplier revenue was $5.1 billion, down 0.9%. Total U.S. spirits revenue fell 2.2% in 2025 while volume rose 1.9%, which is the signature of consumers trading down, not quitting.
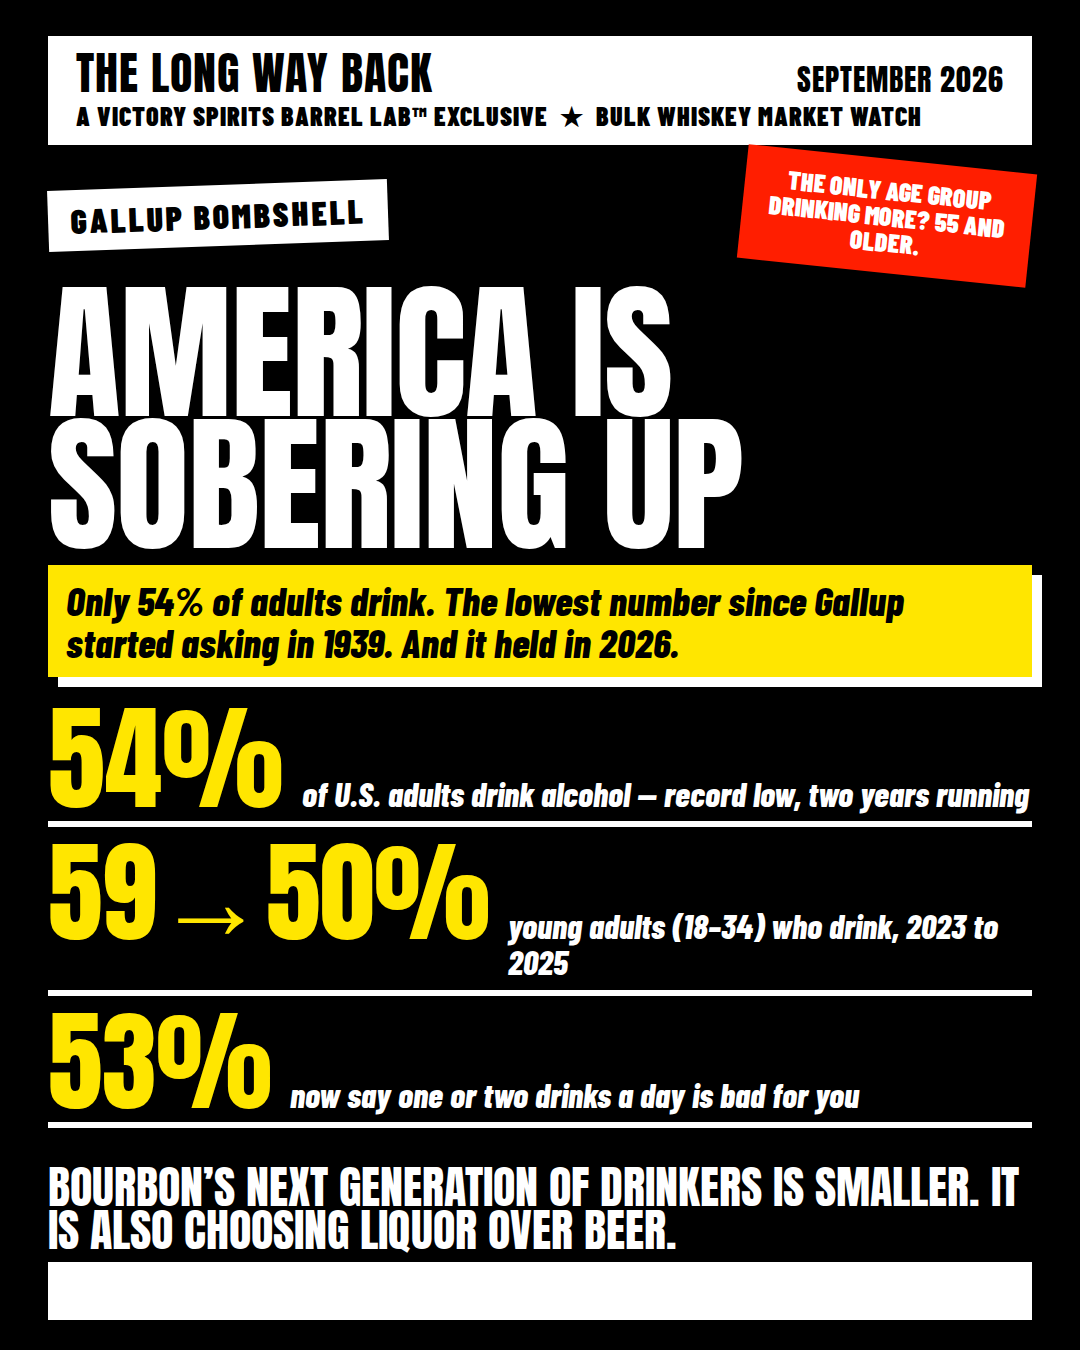
The worry is the next cohort, and here the numbers are worse than the trade likes to admit. Gallup's July 2026 survey found 54% of U.S. adults drink alcohol, unchanged from 2025 and the lowest reading since the question was first asked in 1939. As recently as 2022 the figure was 67%.
Break it out by age and the shape is clear. Among adults 18 to 34, the share who drink fell from 58% in 2023 to 50% in 2026. The 35 to 54 group went from 66% to 58%, and 55 and older from 61% to 55%. A year ago the older group was the lone holdout, still drinking more; in 2026 every age group declined. Fifty-one percent of Americans now say one or two drinks a day is bad for your health, up from 27% in 2001. That is not a fad. It is a generation of public-health messaging landing.
That second fact is the one to hold onto. Spirits are taking share of a shrinking pool. Since 2000 spirits have gained more than 13 points of U.S. beverage-alcohol market share, and each point is worth about $860 million in supplier revenue. Whiskey does not need the drinking rate to recover to stay flat; it needs its share gains to keep outrunning the decline in the base. Through 2025 they roughly did.
Then there is the swing factor nobody in the domestic debate controls: exports. American spirits exports fell 9% in the second quarter of 2025 and Kentucky bourbon exports were down 13% through the first half. Canada, once 10% of American rye exports, delisted American spirits and, in the words of the Distilled Spirits Council, "disappeared." Brown-Forman reported Canadian sales down 60%. Kentucky bourbon had already lost about $500 million in exports to retaliatory tariffs since 2018. A good share of the whiskey now sitting in Kentucky rickhouses was distilled to be bottled and shipped abroad. A trade settlement would put that volume back faster than any change in domestic habits.
What can be forecast, and what cannot
A demographic model we reviewed while preparing this series projected U.S. bourbon demand drifting from about 17.6 million cases in 2026 to 17.0 million in 2040 as Boomers and Gen X shrink and Gen Z fails to replace them on volume. The direction is defensible. The figures are not: no public series tracks bourbon-only volume, and no public series tracks bourbon by age statement. Anyone who shows you a curve of "7+ year premium share rising from 28% to 38%" is showing you an assumption, not a measurement.
Here is what the data supports. American whiskey volume is flat to slightly down and will likely stay in a 28 to 31 million case band through the decade absent a trade shock in either direction. The consumer base is aging and shrinking, and the share of it that prefers spirits is rising. Premiumization has paused in the aggregate (revenue falling faster than volume) but not at the top, where 8+ year barrels still command brand pricing.
What this means for supply. At 30 million cases a year, allowing for bottling proof and yield, the industry draws roughly 1.3 to 1.6 million barrels of aged whiskey a year, domestic plus export. That figure is our estimate, not a published statistic. Against 16.1 million barrels in Kentucky alone it is about ten years of cover. The historical comfort zone was six to eight. Demand is not going to close that gap. Only the fill curve can, and that is Part 3.
Next: The Fill Curve.
What are your barrels worth in an orderly market?
Barrel Lab™ lists bulk spirits in the barrel with verified provenance and a real value, not a fire-sale bid. Licensed buyers enter with a DSP permit.
Enter Barrel LabBarrel Lab™ researched, charted, and drafted this with AI for the people who own the barrels. Every number traces to a source linked in the whitepaper. We think that is how brands should use these tools: to do the work faster and show it, not to make things up.