

The Long Way Back · Part 3 of 5
The Fill Curve
Seven straight years of filling more than the market drinks, then the biggest cut in memory. It stopped the flood. It has not started the drain.
Kentucky distillers filled 1.7 million barrels of bourbon in 2018. Five years later they filled 3.2 million. That is the glut, and it took exactly one chart to make.
The black bars are the record. Fills crossed 2 million in 2019 for the first time since 1967 and never looked back: 2.44 million in 2020, 2.62 million in 2021, 2.7 million in 2022, a record 3.2 million in 2023 and 3.03 million in 2024. Every one of those years the KDA press release used the word "record," and every one of those years was, in hindsight, a year the industry was betting that the 2012–2022 growth curve would continue.
The line is the number nobody publishes directly: how many barrels leave Kentucky's warehouses each year to be bottled or shipped. It can be backed out of the KDA's own figures. Take the inventory on January 1, add that year's fills, and subtract the next January's inventory. For 2019 that gives 1.35 million barrels, and the KDA separately reported about 1.36 million emptied that year, which is how we know the method works. It gives about 1.5 million a year for 2021 through 2023, and only 1.23 million for 2024 as sales slowed.
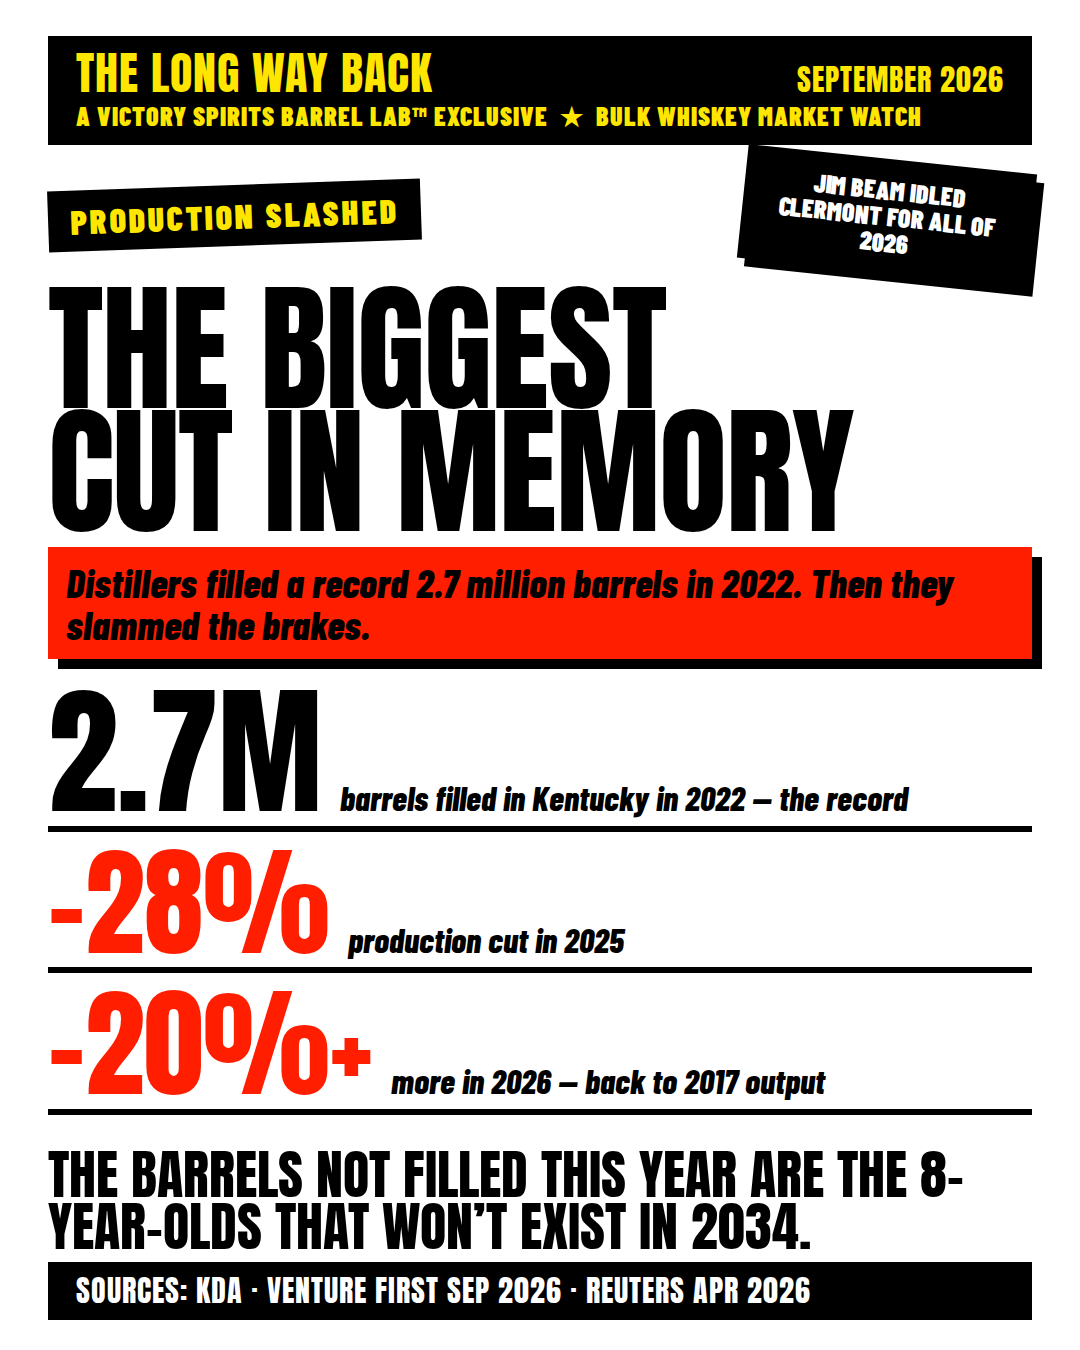
The red bars are what happens next, and they are estimates. Venture First, which valued 555,000 barrels in 2025, puts the 2025 production cut at 28% and 2026 at another 20% or more, taking output back to roughly 2017 levels. TTB data for January through April 2025 showed whiskey production down nearly 28% year over year, the lowest since 2019. Jim Beam idled its Clermont campus for all of 2026. Heaven Hill is cutting even as it opens a new plant. We apply the announced cuts to the 2024 base, which gives about 2.2 million barrels in 2025 and 1.75 million in 2026, and hold 2027–2028 near 1.6 million. Going forward we put withdrawals at 1.45 million a year.
The lines do not cross
That is the part the first version of this article got wrong. The red bars come down fast, but at 1.6 million they are still above the 1.45 million barrels leaving the warehouse. The gap shrinks from 1.8 million barrels a year in 2024 to about 150,000, and the pile keeps growing: roughly 17.15 million barrels on January 1, 2027, and still rising. The cut stopped the flood. It did not start the drain.
Before the boom, Kentucky held about six years of whiskey against what it drew down: 8.5 million barrels against 1.35 million in 2019. Today it holds eleven. Getting back to eight years, about 11.6 million barrels at today's withdrawal rate, means working off more than 5 million barrels. Here are three ways it could go.
| Path | Fills from 2027 | Leaving the warehouse | Inventory peaks | Back to 8 years of cover |
|---|---|---|---|---|
| A. Cuts as announced | 1.6M a year | 1.45M a year | Does not peak | Not on this path |
| B. Cut to 1 million | 1.0M a year | 1.45M a year | 17.15M, Jan 1 2027 | About 2040 |
| C. Cut to 1 million, exports return | 1.0M a year | 1.7M a year | 17.15M, Jan 1 2027 | About 2033 |
On the cuts as announced, inventory never comes down. Cut fills to around 1 million barrels a year and it starts to fall in 2027, but at 450,000 barrels a year it takes until about 2040 to reach normal. Add a recovery in exports, which lifts withdrawals to 1.7 million, and it gets there around 2033. A further step down in the drinking rate pushes every one of these dates back.
When the old whiskey gets scarce
The total is not the whole story, because what a barrel is worth depends on its age. KDA's February 2026 economic report says 70% of Kentucky's inventory, 11.4 million barrels, was produced in the last four years and only 3% is older than eight. That is why eight-year-old whiskey still commands a premium today.
But a barrel turns eight on a fixed schedule, and the schedule is set by the bars above. The 2018 fills turned eight this year. The record 2023 fill turns eight in 2031. So the most eight-year-old bourbon Kentucky can have rises every year through 2031 and only then falls.
Those are ceilings. Many of the 2021–2024 barrels are being bottled or sold young right now, and every barrel pulled early is one fewer eight-year-old later. But the direction is set. The 2021 through 2024 fills, about 11.5 million barrels, are the whiskey clearing at cost today, and they become the biggest crop of eight-year-olds Kentucky has ever had from 2029 through 2032. The 2025 and 2026 fills, roughly 4 million barrels instead of the 6 million the 2023–2024 pace would have produced, are the eight-year-olds that will not exist in 2033 and 2034. Nobody can fill them later. Age is the one input in this business that cannot be bought, only waited for.
So the glut and the gap are still the same barrels. The gap is just further out than the headlines, and our first draft, suggested. For a barrel owner, the question is not whether to wait for 2030. It is whether a barrel has provenance and a path to a buyer or a bottle that does not depend on the bulk market coming back into balance, and what it costs to carry it until it does. That is Part 5. First, Part 4: what a barrel is worth when the seller has no time.
Next: What a Barrel Is Worth in a Forced Sale.
What are your barrels worth in an orderly market?
Barrel Lab™ lists bulk spirits in the barrel with verified provenance and a real value, not a fire-sale bid. Licensed buyers enter with a DSP permit.
Enter Barrel LabBarrel Lab™ researched, charted, and drafted this with AI for the people who own the barrels. Every number traces to a source you can open. We think that is how brands should use these tools: to do the work faster and show it, not to make things up.